Profile Image Analysis application (PIA)
This software application was developed for Acacia Biosciences,
a biotech company whose core technology was a collection of over 6000
yeast strains, each of which carried a fusion between one particular
yeast gene promoter and a green fluorescent protien. The
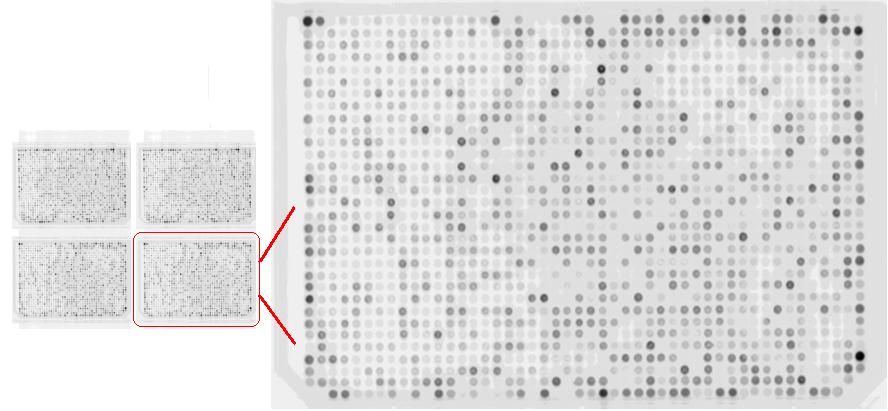
collection was grown in sixty-four 96-well plates, and these were used
to spot the yeast onto four solid plates for each experiment, with 1536
distint colonies on each plate. The activity of the reporters was
assessed using a fluorescent imaging system. The purpose of the
software we created was to analyze the resulting images to quantify the
relative brightness of each yeast colony.
The Profile Image Analysis (PIA) application was written in Microsoft Visual Basic 6.0. After quantitation of the fluorescence of each reporter in image, it would record the results into the corporate data storage. The program was connected to the LIMS (called 'ChemTrak'), which held the information about each experiment. PIA could function in batch mode, or completely automatically (scanning for new images to process).
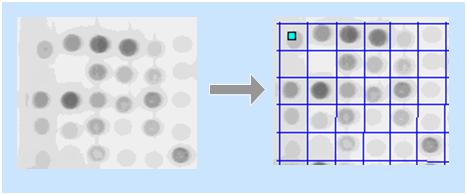
The first step in analysis of the plate image was the placement of the quantitation grid. The placement was complicated by the fact that colony array was sometimes rotated slightly relative to the plate, as well as by occassional poor spot placement by the spotting robots or poor colony growth. The grid placement algorithm dynamically adapted to these problems.
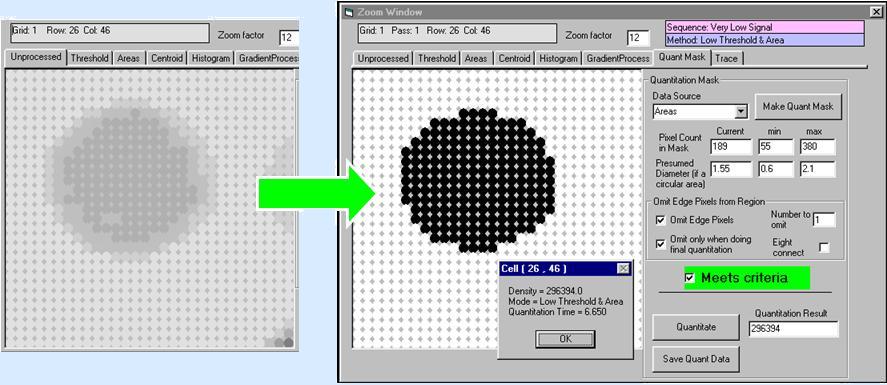
After grid placement, each spot was individually detected and quantified. The decision about which pixels were part of the colony relied upon a heuristic adaptive image analysis process. The algorithm used thresholding and edge tracing, and adjusted for colony size, poor growth, and growth artifacts such as donuts and bulls-eyes. It automatically detected missing reporters.
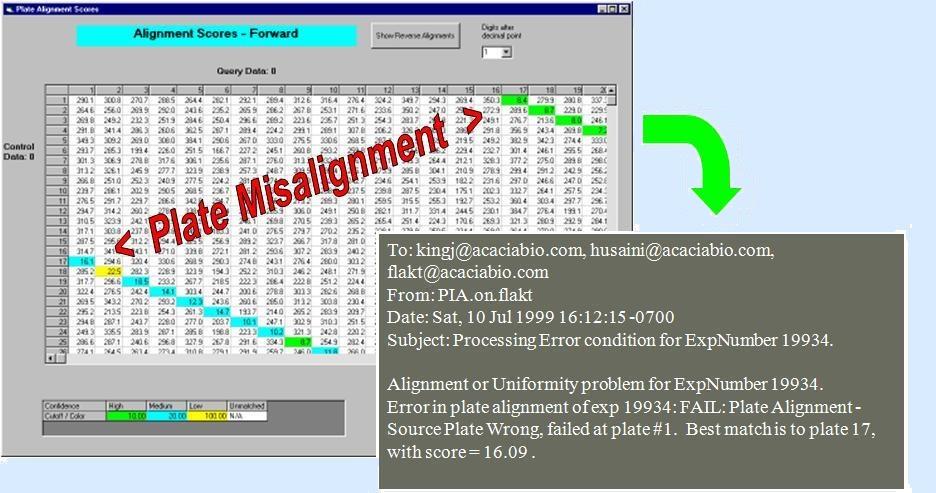
The PIA program included advanced error checking: it detected & cataloged missing spots (missing reporters, eliminated from downstream analysis); it detected source plate inversions & plate swaps; it monitored for uneven growth across plate; it reported images that technician had to process semi-manually; and it would send an email to a supervisor if there was a serious system problem.