The client was engaged in a long series of TaqMan real-time PCR experiments, using a set of mRNA's extracted from various tissue sources. This resulted in a dataset that contained the relative expression level of the tested genes in all of the tissues in the panel. They needed a way to organize and display the data.
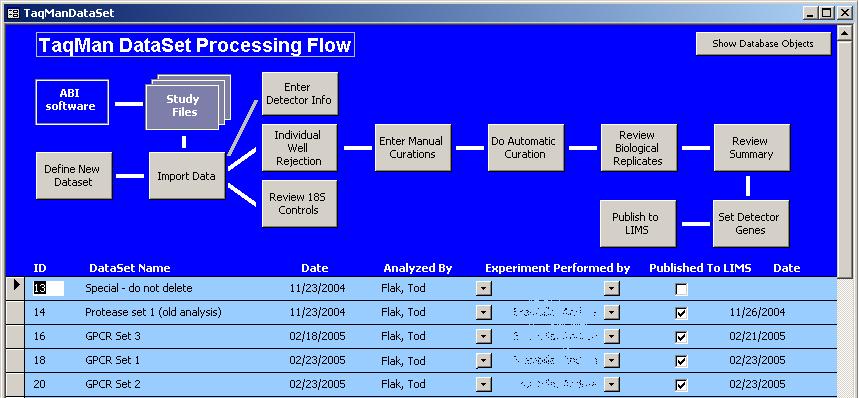
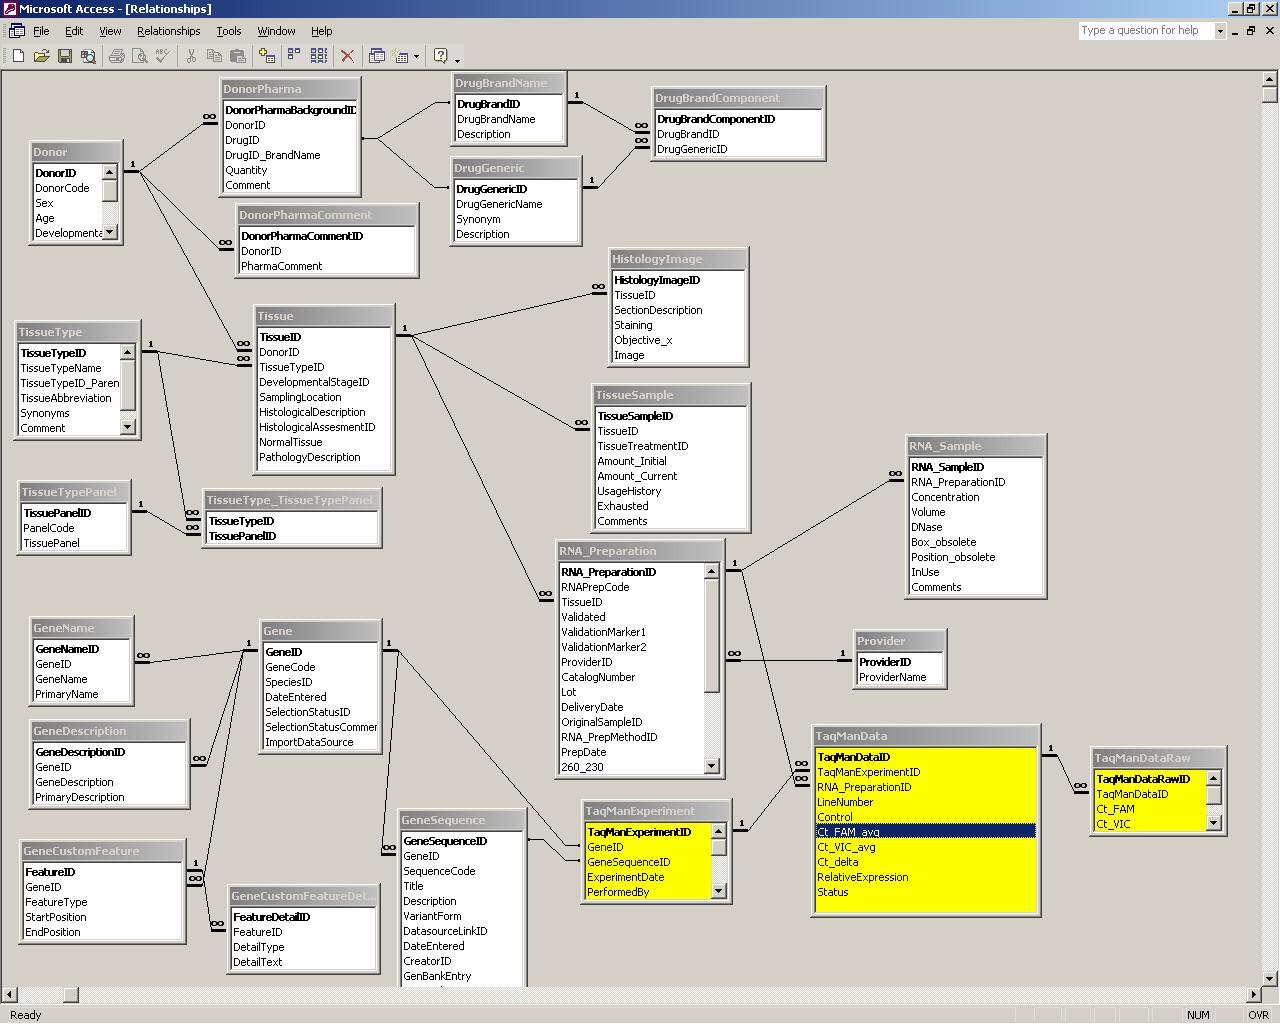
We developed several compenents to create a system to manage this data. First, we created a Microsoft Access database that was used as an initial importer of the flat-file data into a structured database format. This database also contained a structured workflow, presented as set of forms, to allow the researcher to properly curate the data (see the figures below). The final step in the curarion process is to publish the data into the corporate LIMS (a SQL Server database).
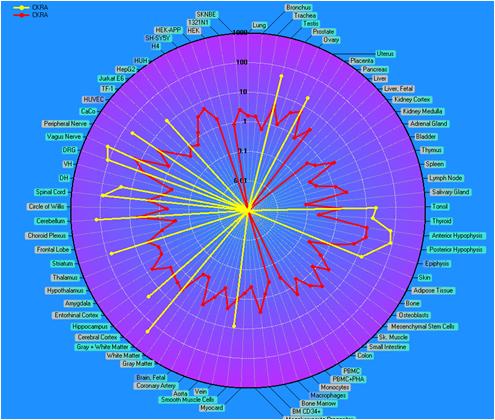
The data display component took the form of a radar-graph, as shown to the right. This display was developed as a Microsoft Visual Basic application. The program connects to the corporate LIMS, and allows the user to select one or more genes to be plotted. Right-clicking on points allows one to bring up a table of the numeric values.